Check autoscaling history
The autoscaling history records the automatically executed actions of a destination pool. For each entry, you can see the time, action, affected destination, result, and reason. If an action has failed, oneclick™ displays the exact error message.
This allows you to track the scaling behavior and analyze errors.
The execution logs of an event profile log each individual execution of an event. By contrast, the autoscaling history shows the autoscaling actions and configuration changes of a destination pool.
Open the autoscaling history
- Open the Resources menu item and select Destination pools.
- Click the List icon for the desired pool to open the details view.
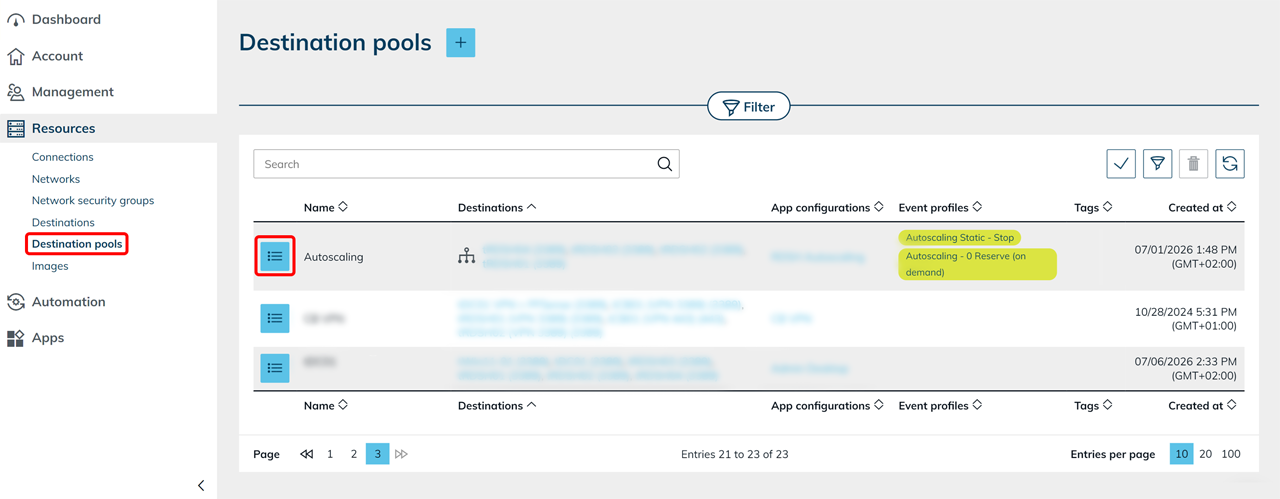
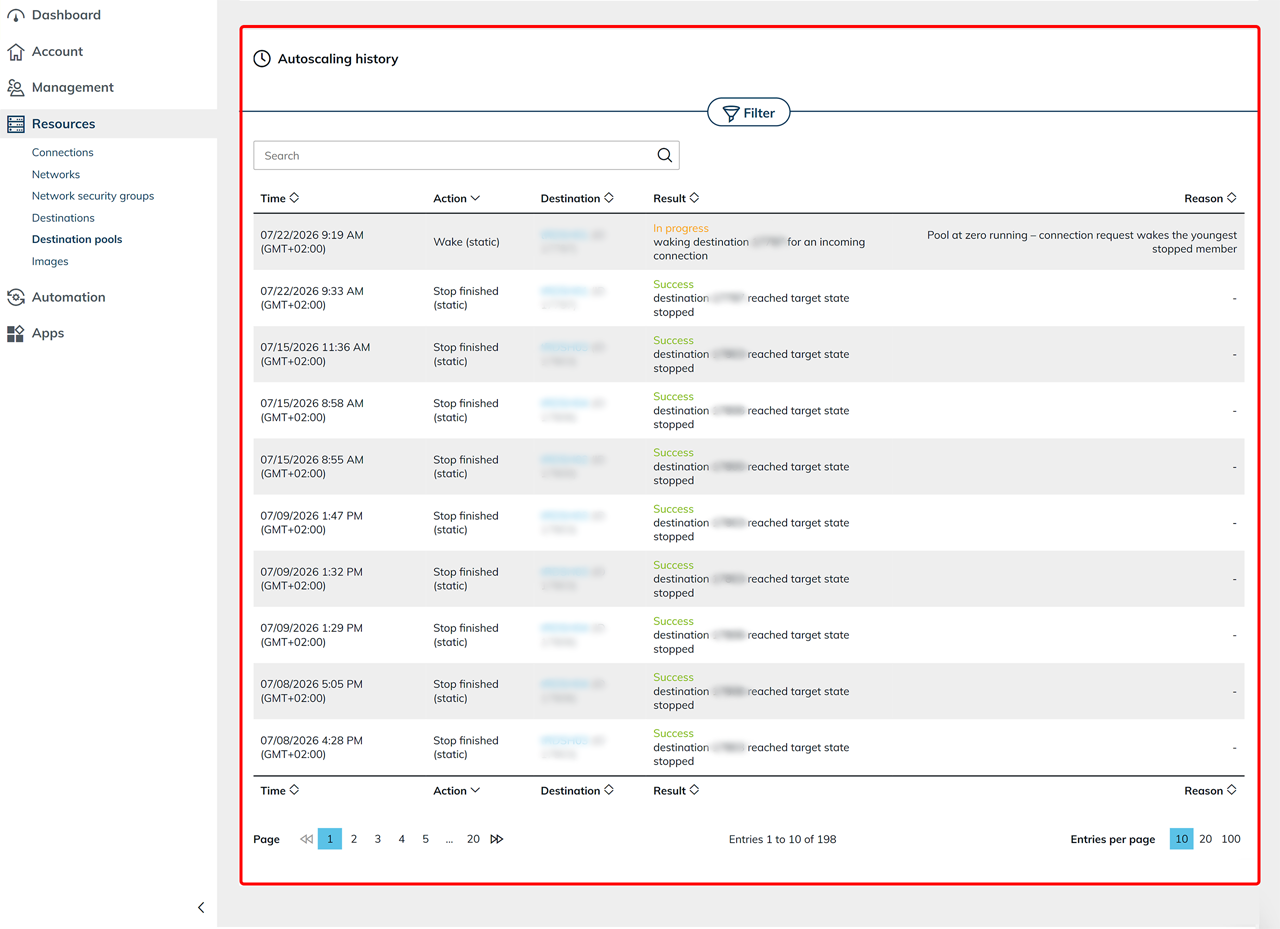
- Scroll down in the details view to the Autoscaling history section. There you can see all logged scaling operations for the destination pool.
Evaluate entries
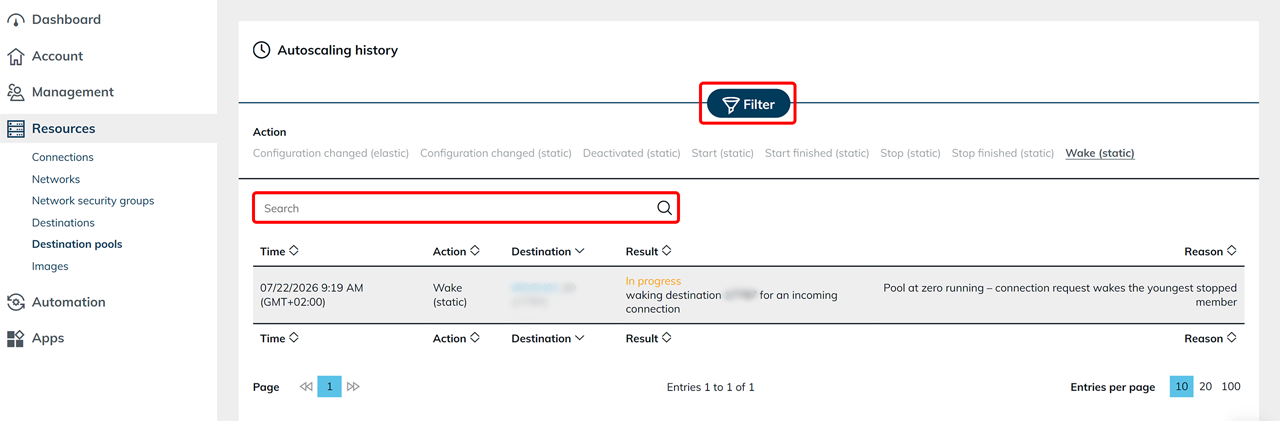
The table contains the following columns:
- Time: time of the entry, including the time zone
- Action: logged autoscaling action
- Destination: name and ID of the affected destination. If the entry applies to the entire pool, oneclick™ displays a dash.
- Result: status and message for the action. In the event of an error, the exact cause is displayed.
- Reason: trigger for the action or changed autoscaling settings
For load-based actions, the Reason column shows the current CPU, RAM, and user values as well as the corresponding thresholds. For a configuration change, it shows the previous and new values of the changed settings.
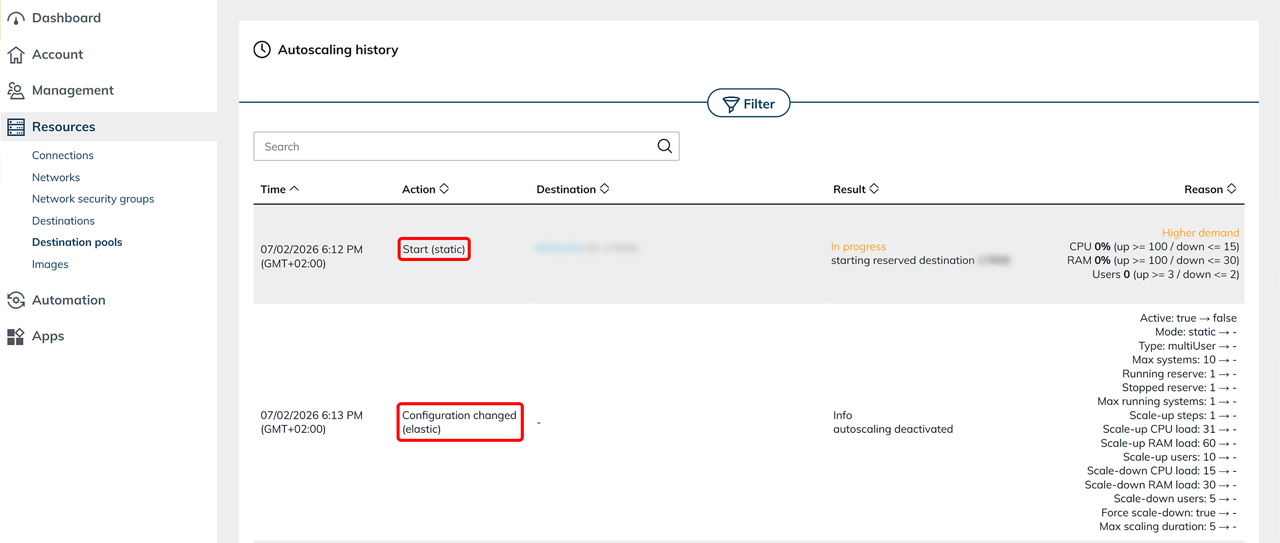
The action label may contain a suffix in parentheses, for example Start (static) or Configuration changed (elastic).
Understand actions
The autoscaling history shows the executed action and the autoscaling mode in parentheses, for example Start (static) or Scale up (elastic). The Reason column shows the trigger for the action or further information about the operation.
| Action | Mode | Result | Meaning |
|---|---|---|---|
| Wake | Both | In progress / Error | When a connection request is made to a pool without a running system, the youngest stopped destination is started. Error: if this destination cannot be started (e.g. cloud connection unavailable). |
| Start | Both | In progress / Error | A reserved, stopped destination is started. Error: if the start command fails. |
| Start finished | Both | Success | The destination is running. |
| Stop | Both | In progress / Error | A running destination is stopped into the reserve. Error: if the stop command fails. |
| Stop finished | Both | Success | The destination has been stopped. |
| Scaled up | Elastic | In progress / Success / Error | A new destination is created (provisioned) to cover increasing load. Error: if cloning the base VM fails or provisioning cannot be completed (e.g. required components cannot be installed or the domain join fails). |
| Scaled down | Elastic | In progress / Success / Info | An automatically created destination is removed when the load decreases. Info: adopted destinations that oneclick™ did not create itself are not deleted, but only removed from management. This action does not have a separate Error status. If deletion gets stuck, a Timeout entry appears instead. If the destination ultimately fails to leave the domain, oneclick™ removes the destination without creating another entry. |
| Configuration changed | Both | Info | Activation, deactivation, or modification of the autoscaling settings through an event profile. |
| Deactivated | Both | Info | Autoscaling for the destination pool was stopped because the event profile was removed or deactivated. In static mode, the existing destinations retain their current state, and oneclick™ no longer starts or stops them. In elastic mode, oneclick™ removes the automatically created destinations, while manually added destinations remain. |
| Timeout | Both | Error | An operation was not completed within the maximum duration and was aborted. Typical causes: stuck domain join, unreachable machine. Static: the state is reset and the system remains; elastic: the stuck system is replaced. |
| Paused | Both | Error | Autoscaling was automatically paused after repeated errors. Resolution: reactivate autoscaling in the settings. |
| Error | Both | Error | An autoscaling run has failed (permanent error, e.g. HTTP error when communicating with a service). |
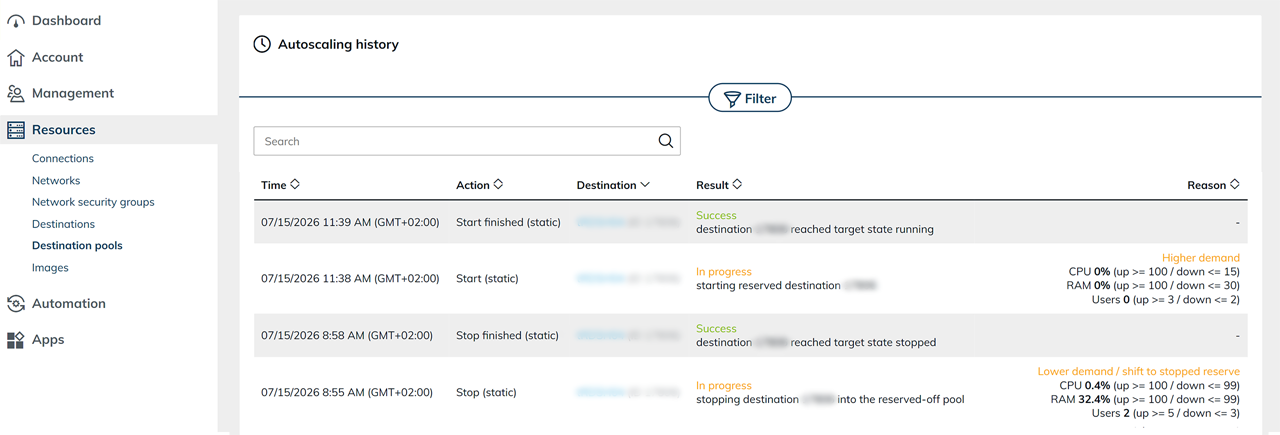
Start and stop operations appear in separate entries. First, the autoscaling history shows the triggered action with the status In progress. Once the destination reaches the target state, a separate entry Start finished or Stop finished appears with the status Success.
A completion entry appears only if the operation succeeds. If the destination does not reach the target state, an entry Timeout or Error appears instead.
Start finished also completes a Wake action because oneclick™ starts a destination as part of this action as well.
Result status
The result of an operation is color-coded:
- Success (green): The operation was completed successfully.
- In progress (orange): The operation was triggered, but the target state has not yet been reached.
- Info (gray): An informational entry without a scaling action, for example a configuration change.
- Error (red): The operation failed. The Result column shows the exact cause.
Static and elastic autoscaling
Two autoscaling modes are available for destination pools.
-
Elastic: the elastic mode creates and deletes virtual machines (VMs) based on the load. This may incur costs from your cloud provider. Manually added VMs are not deleted.
-
Static: the static mode starts and stops only existing virtual machines (VMs) in the pool based on the load. No VMs are created or deleted.
In the autoscaling history, action labels may contain suffixes such as (static) or (elastic). For start and stop operations, oneclick™ shows the triggered action and successful completion in separate entries.
Filter, search, and sort entries
- Filter: Click Filter to narrow down the displayed entries by “Actions”.
- Search: Use the Search field above the table to further narrow down the displayed entries.
- Sort: Click a column heading to sort the entries by that column.
Refresh and retention
The autoscaling history is automatically refreshed every 30 seconds. New operations therefore appear without manually reloading the page. Entries in the autoscaling history are retained for 30 day and then automatically removed.
For destination pools without an active autoscaling event profile, the autoscaling history contains no entries. As soon as autoscaling is active and the first scaling operation has taken place, the entries are displayed automatically.